
Online Personal Loans
Online loans for a better financial future. Our goal is to make sure every borrower has the support they need.
Applying does NOT affect your FICO® credit score.2
Loans from
----
Repayment term4
----
APR
----
The figures above are examples of our lending partner’s typical installment loan offers and do not serve as guarantee of any rates & terms that you may qualify for.
Testimonials reflect the individual's opinion and may not be illustrative of all individual experiences with OppLoans.
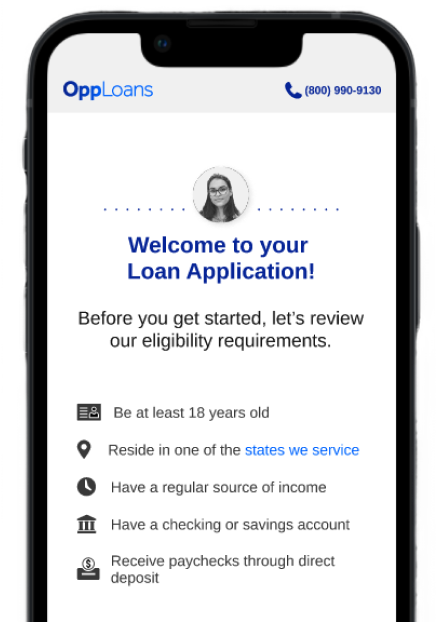
Simple Loan Application Process
Working with community banks, the OppLoans platform offers personal loans designed to fit your needs. The process is simple and built around you:
-
Apply Online
The application process is quick and easy, with decisions often made in minutes. -
Approval Process
Our Bank Partners consider more than just your credit score, so even if you’ve been turned down by others, you may still qualify. -
Same-Day Funding Available
If approved, you may receive money in your account as soon as the same business day!1
Explore Your Personal Loan Options with OppLoans
Applying does NOT affect your FICO® credit score.2
What Can I Use an Online Loan For?
Online loans to tackle bills like:
How to Choose an Online Personal Loan Lender
When you’re in a difficult financial situation, an online personal loan from a trustworthy lender can help you regain control of your finances. That’s why it’s important to find the best lender for your needs.
- Speed: We want to get you back on track as soon as possible. If you meet our eligibility requirements, you’ll know if you’ve been approved for an online loan in minutes. Approved OppLoans applicants may receive their online loan as soon as the same business day.1
- Affordability: Payday5 Loans average an APR of 400%. The typical APR of an installment loan through OppLoans is less than half the average payday loan.4
- Customer Service: Don’t just take our word for it, OppLoans is highly rated on Trustpilot and LendingTree for our unmatched customer service.3 Our Loan Advocates want to answer all your questions.
- Mobile Friendly: Apply for an online loan through OppLoans on your phone or computer. Simply click Apply Now to get started.
- No Hard Credit Inquiries: Applying for an online loan through OppLoans won’t impact your FICO credit score.2
Three Types of Online Loans to Know About
As you’re looking to take out an online loan, you’ll want to make sure you know the ins and outs. Here’s a breakdown of three different types of online loans you may encounter.
FAQs
An online personal loan is a loan made to an individual rather than a business. They are usually sought in order to consolidate debt or to cover emergency expenses. The two main types of online personal loans are “secured” loans and “unsecured” loans.
Secured Loan: A secured loan is one where property is pledged as collateral. For instance, a mortgage is a secured loan with the borrower's house serving as collateral. Should the borrower be unable to repay and default on the loan, the collateral will be claimed by the lending institution as compensation.
Unsecured Loan: An unsecured loan is one where no property is pledged as collateral. The loan is approved entirely on the individual's ability to repay.
Outside of mortgages and auto loans, the majority of online personal loans are unsecured. Because the borrower's credit score is a major factor in determining their creditworthiness, individuals with low credit scores are usually unable to get approved for an unsecured, online personal loan from a bank or traditional lender.
OppLoans leverages cutting-edge technology and customer data to evaluate our customers on a person-by-person basis. We work with our lending partners to tailor products available through the OppLoans Lending Platform toward a customer's ability to repay.
Personal loans can help you achieve many different types of financial goals. Maybe you’re looking for a loan to help consolidate debt from multiple credit cards, or maybe you need to fund an expensive home improvement or car repair. The right online loan may also help you build credit.
OppLoans gives customers the chance to tackle:
Understanding the terms and conditions of a loan is important, no matter your financial situation.
Borrowers should always be clear on the interest rate, repayment terms, and whether or not the lender will run a hard or soft credit check.
We truly care about our customers and work hard to be flexible for each of our customer's unique situations. We want to make sure borrowers get the best loan from one of our bank partners made through the OppLoans Lending Platform.
Unlike some financial institutions (and quite unlike payday loans5), bank partners don't charge origination fees or prepayment fees on loans originated through the OppLoans Lending Platform. Loans originated through the OppLoans Lending Platform charge simple, fixed rate interest and contain no hidden fees.
Loans made by our bank partners through the OppLoans Lending Platform do not base funding decisions exclusively on FICO credit scores or credit history.
Further, OppLoans reports payments to all three major credit bureaus to help borrowers in good standing build their credit history.6